Global disruption, tuned for Australian supply chains.
Sentinel turns fragmented global signals — fuel, international trade and network disruption — into clear online dashboards, then filters them for what actually moves Australian supply chains. Built for Australian businesses, importers, exporters and logistics teams.
Sentinel watches the world — global fuel markets, international trade and network disruption — but it reads every signal for what it means at home. Tariff shifts, port congestion and fuel volatility are translated into the impact on Australian operations, costs and lead times.
It's market intelligence with global coverage and Australian relevance — purpose-built for the businesses, importers, exporters and logistics teams that keep Australia's supply chains moving.
Australian signals we track
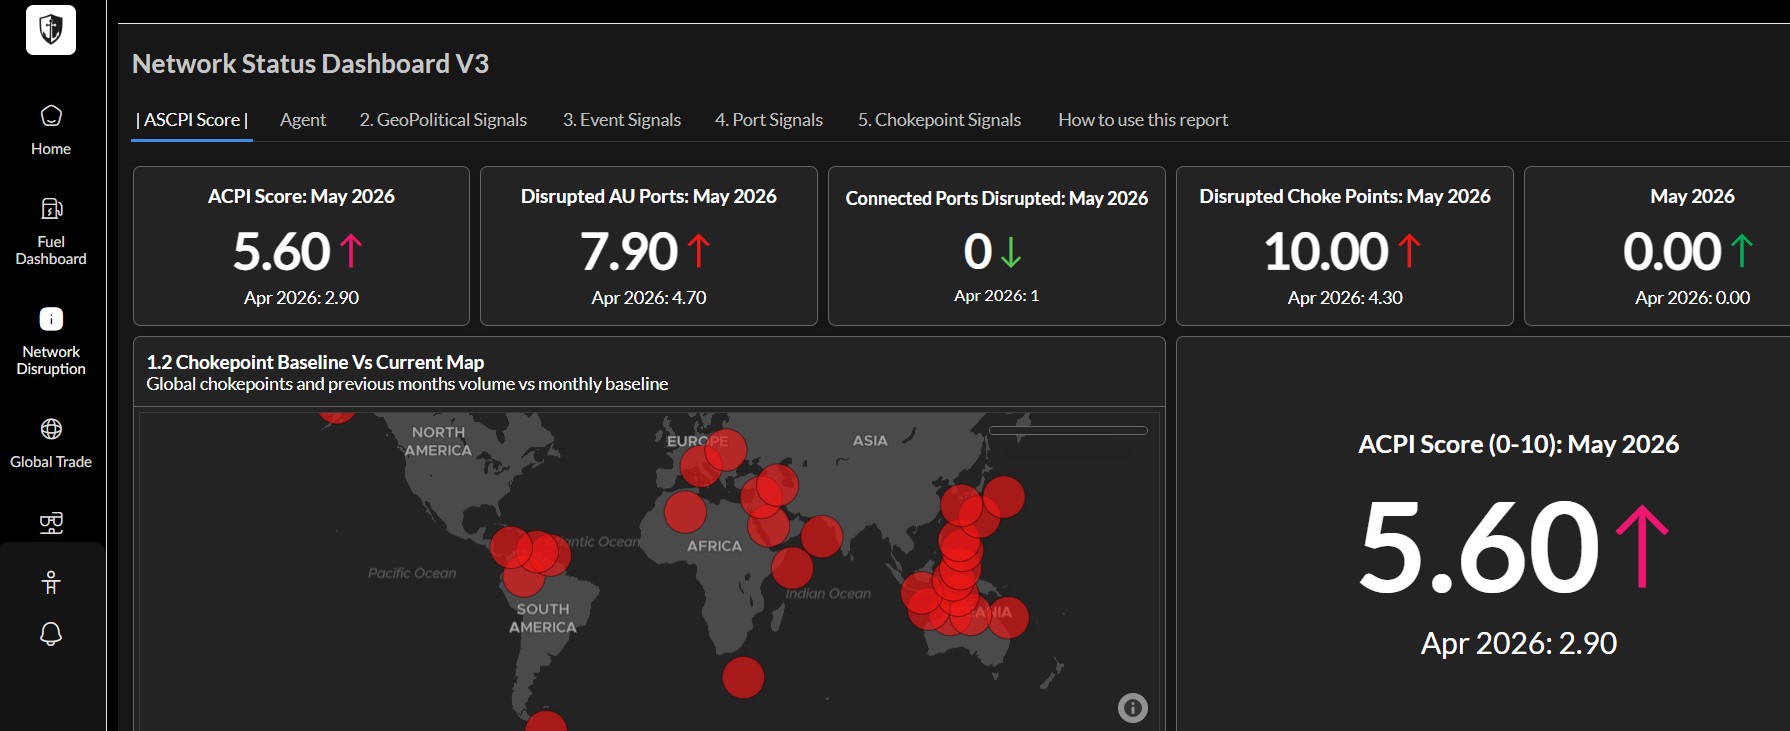
Australian port & network disruption
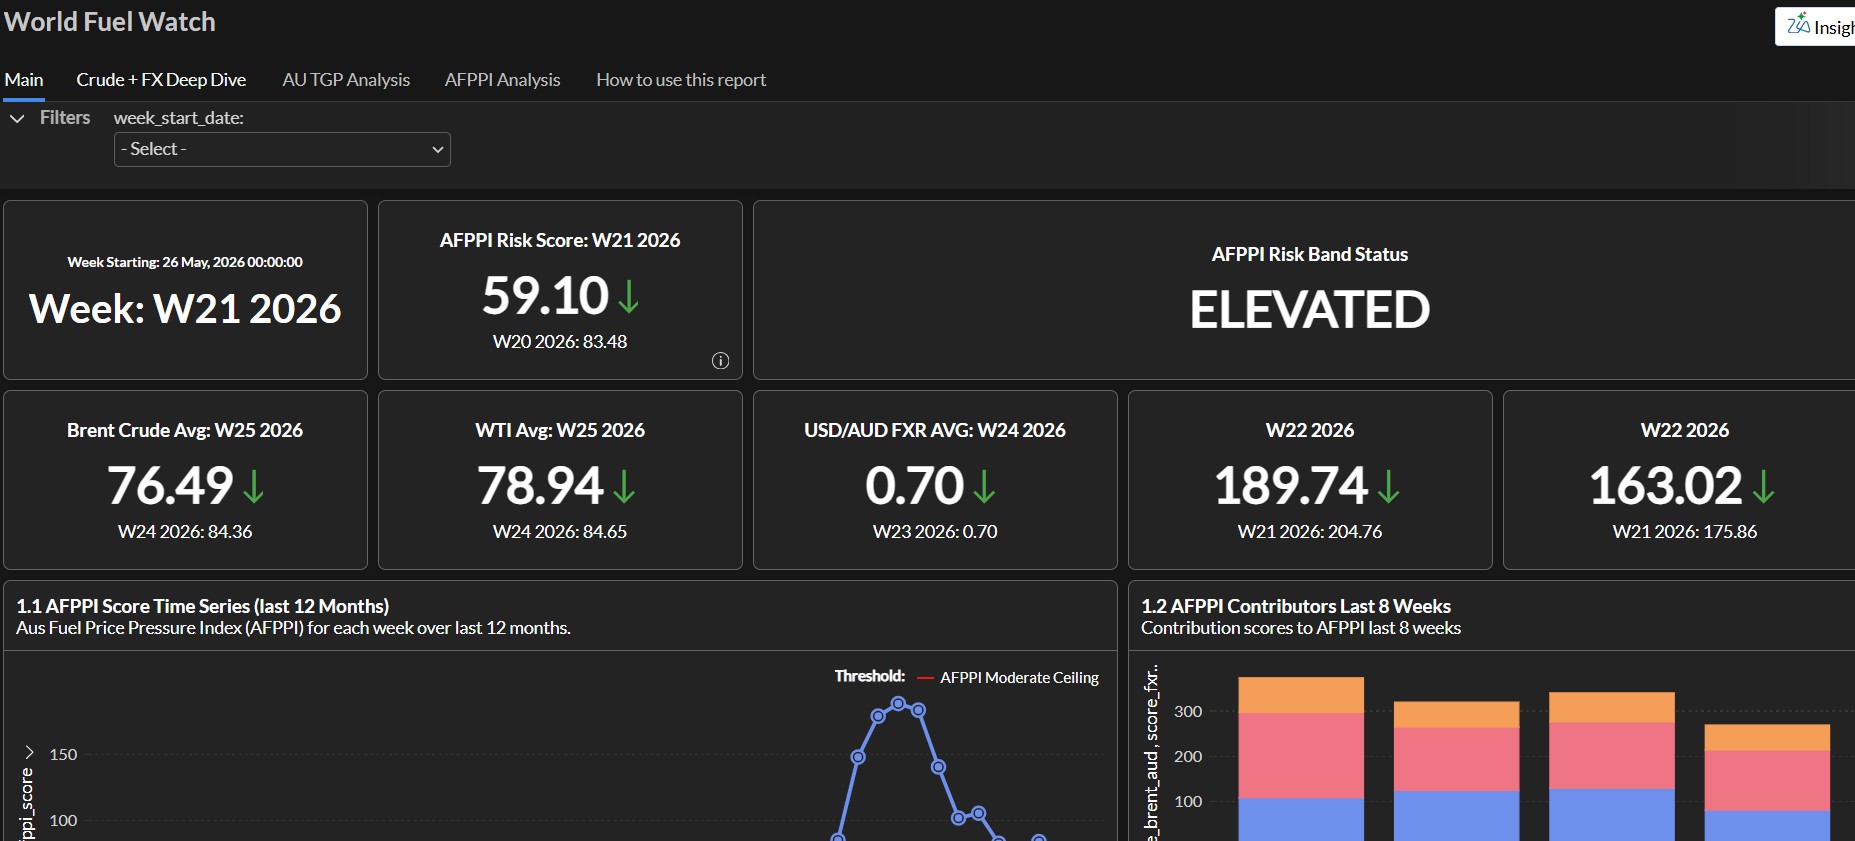
Australian Fuel Price Pressure Index (AFPPI)
AUD / USD exchange-rate exposure
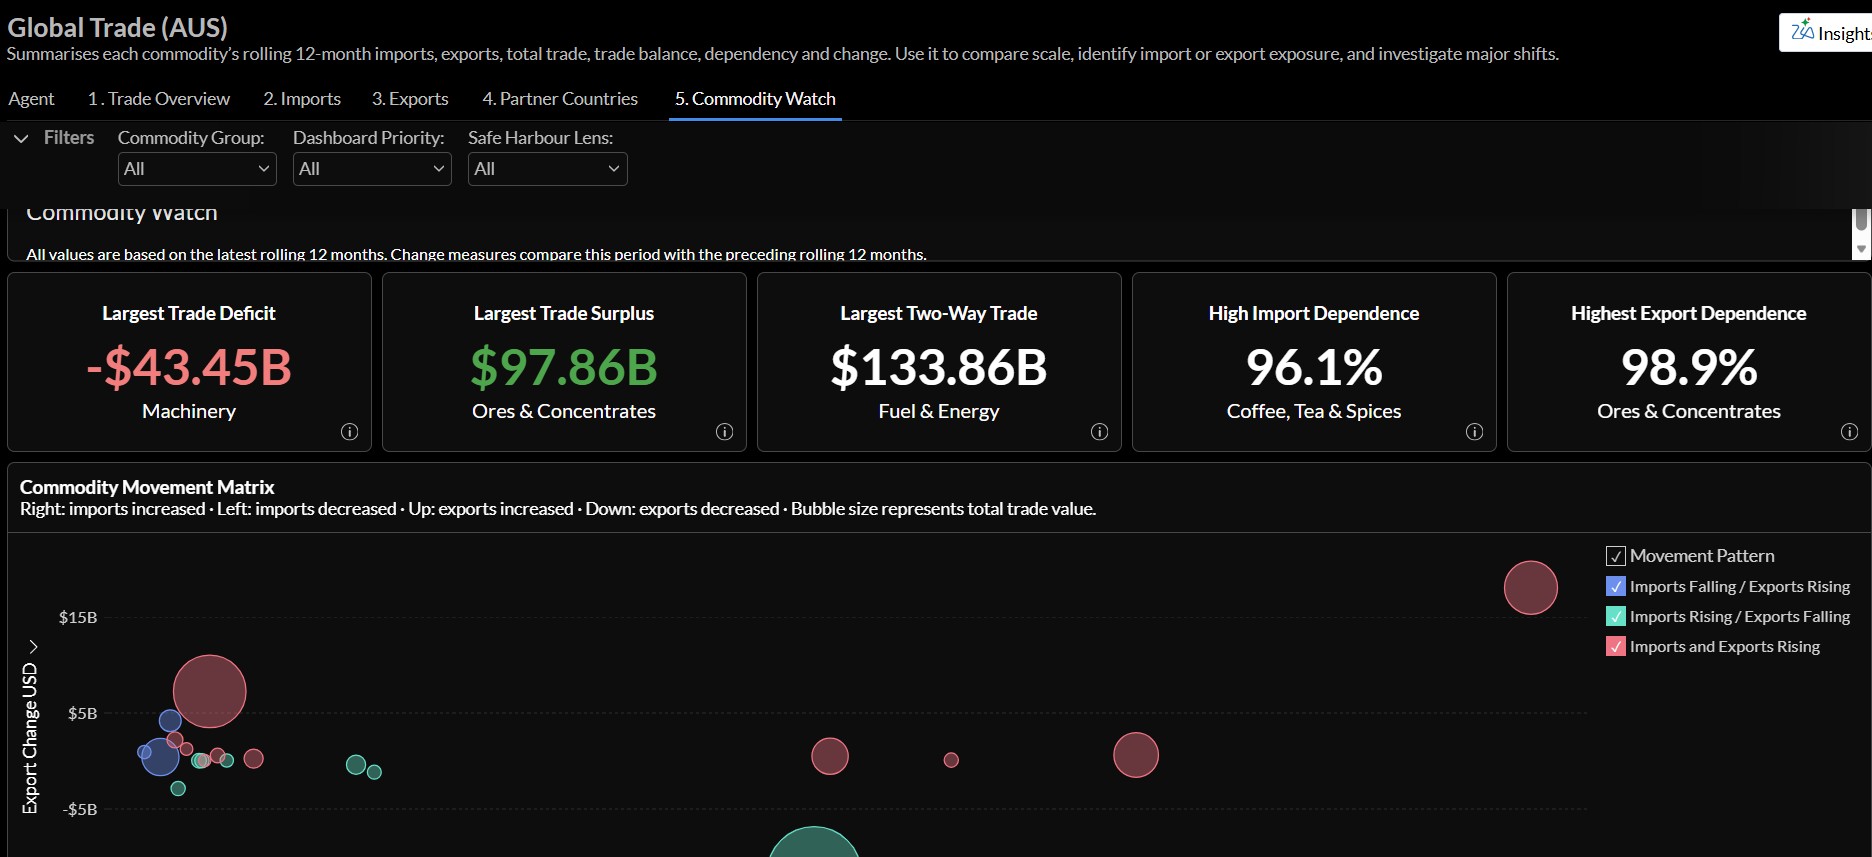
Australian import & export trade balances
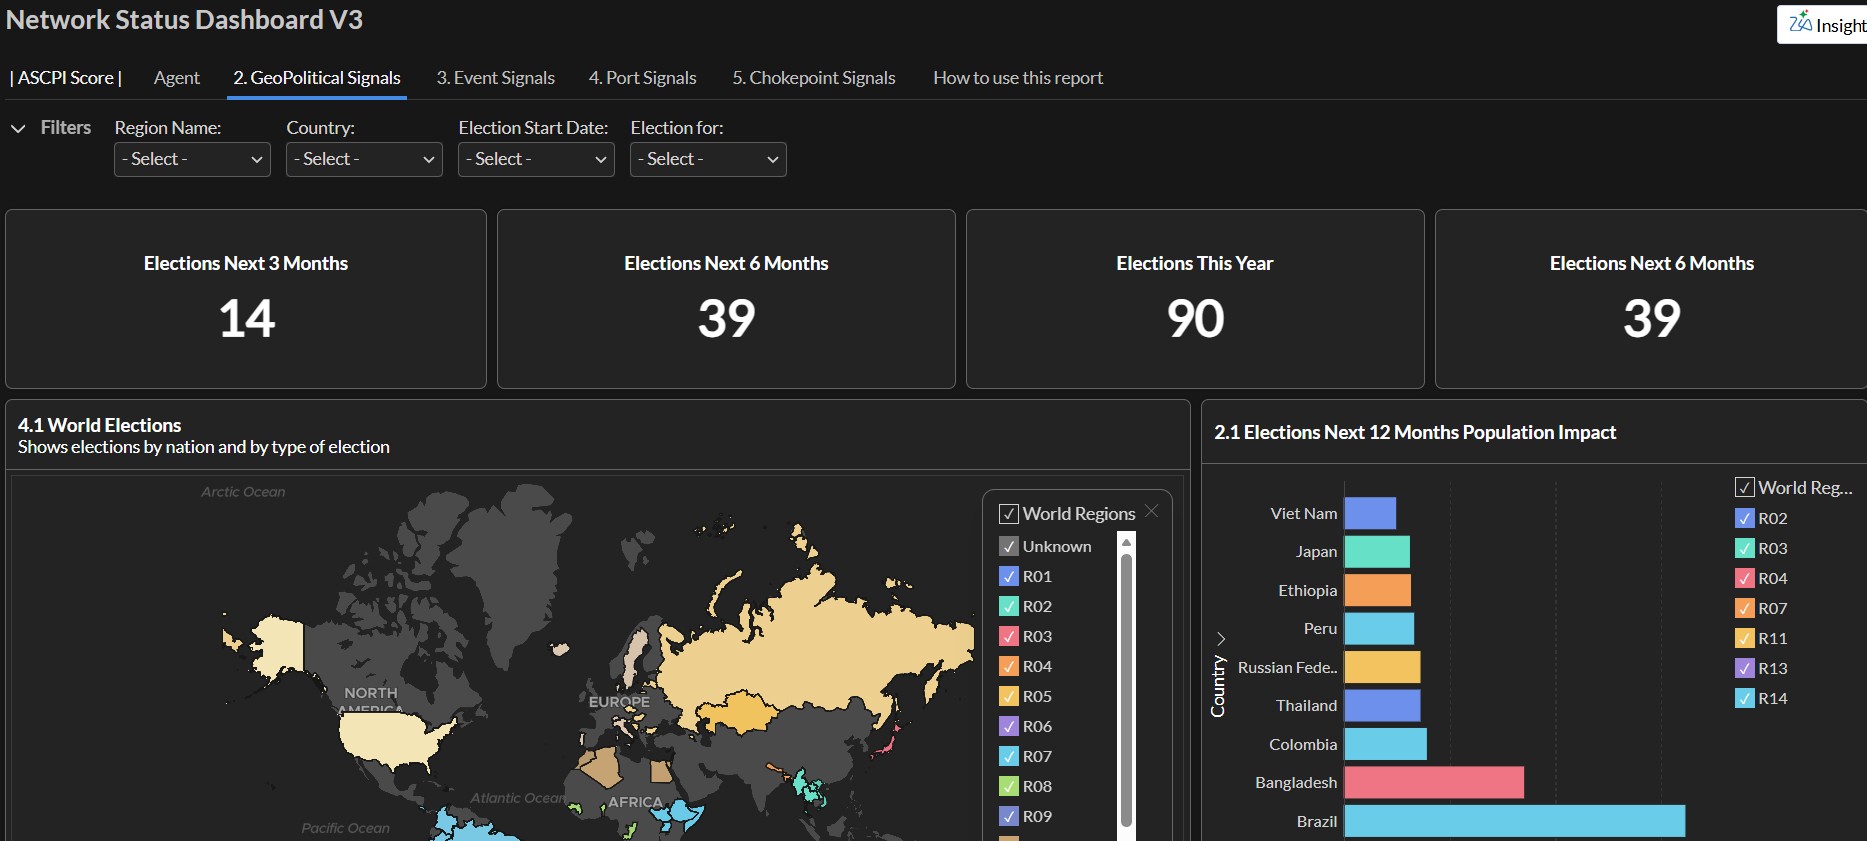
Geopolitical & election signals affecting AU trade
// Inside Sentinel
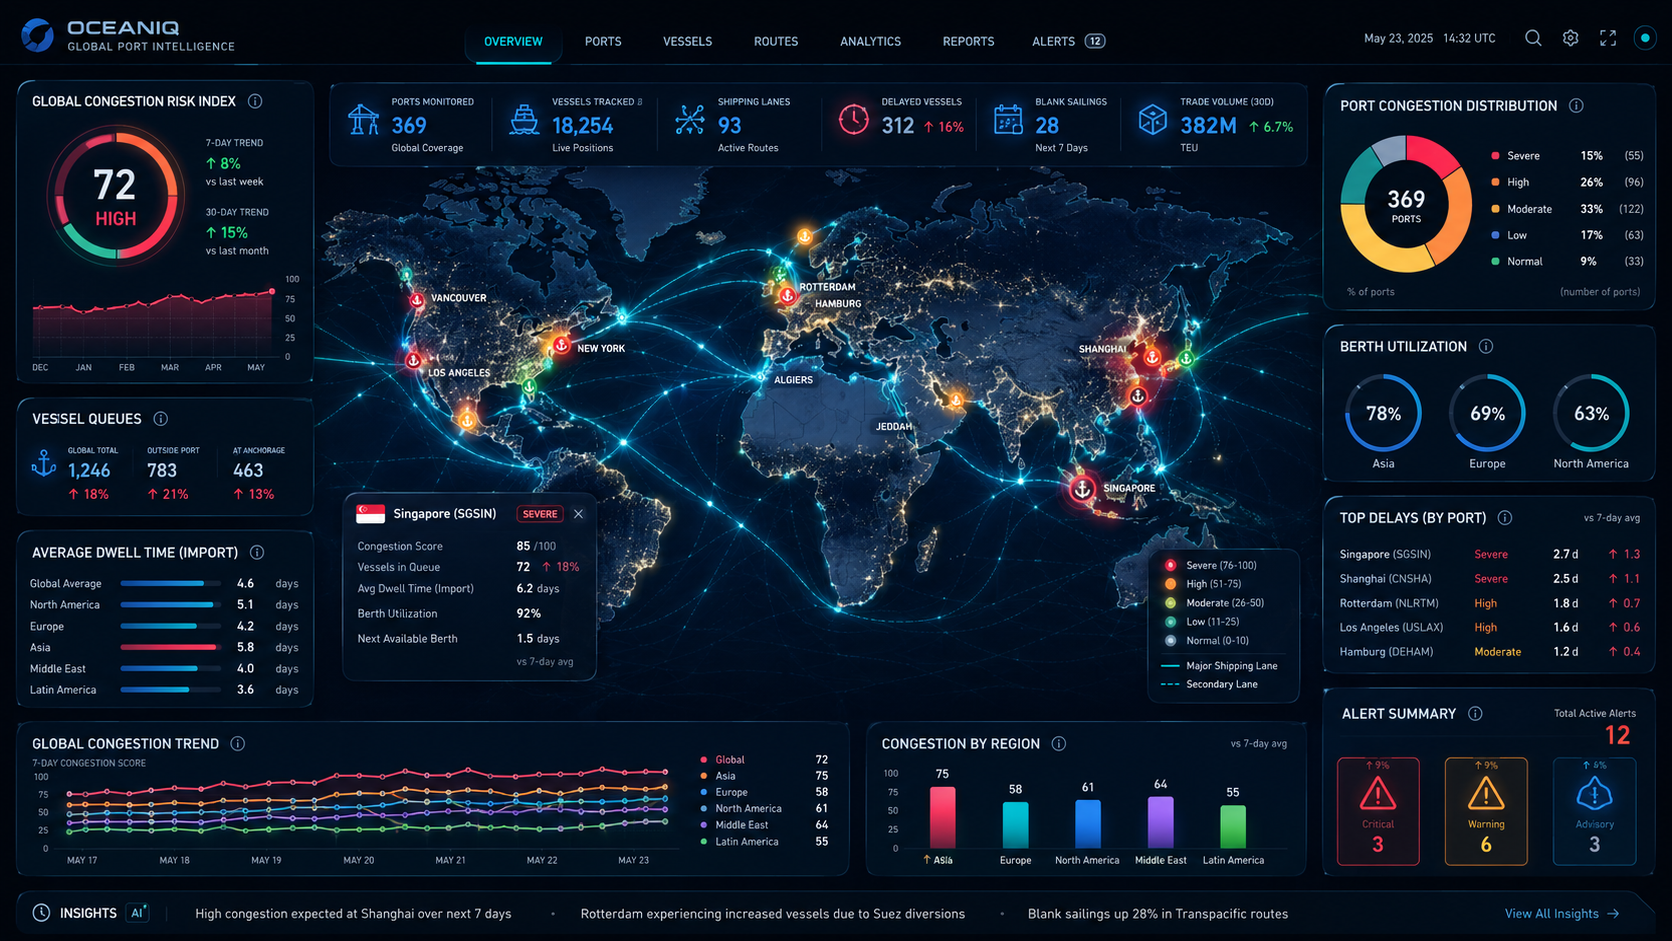
Live dashboards, built for decisions.
LIVE FEED · MAY 2026
GLOBAL FUELWORLD FUEL WATCH
INTERNATIONAL TRADEGLOBAL TRADE
NETWORK DISRUPTIONNETWORK STATUS
GEOPOLITICAL SIGNALSEVENT WATCH
// Dashboard intelligence
See the pressure. Understand the cause. Act earlier.
Signing up gives your team a single place to monitor the global factors that matter to Australian supply chains — with exclusive pressure indexes and expert analysis turning complex data into practical decisions.
01 / 03
01 / 03
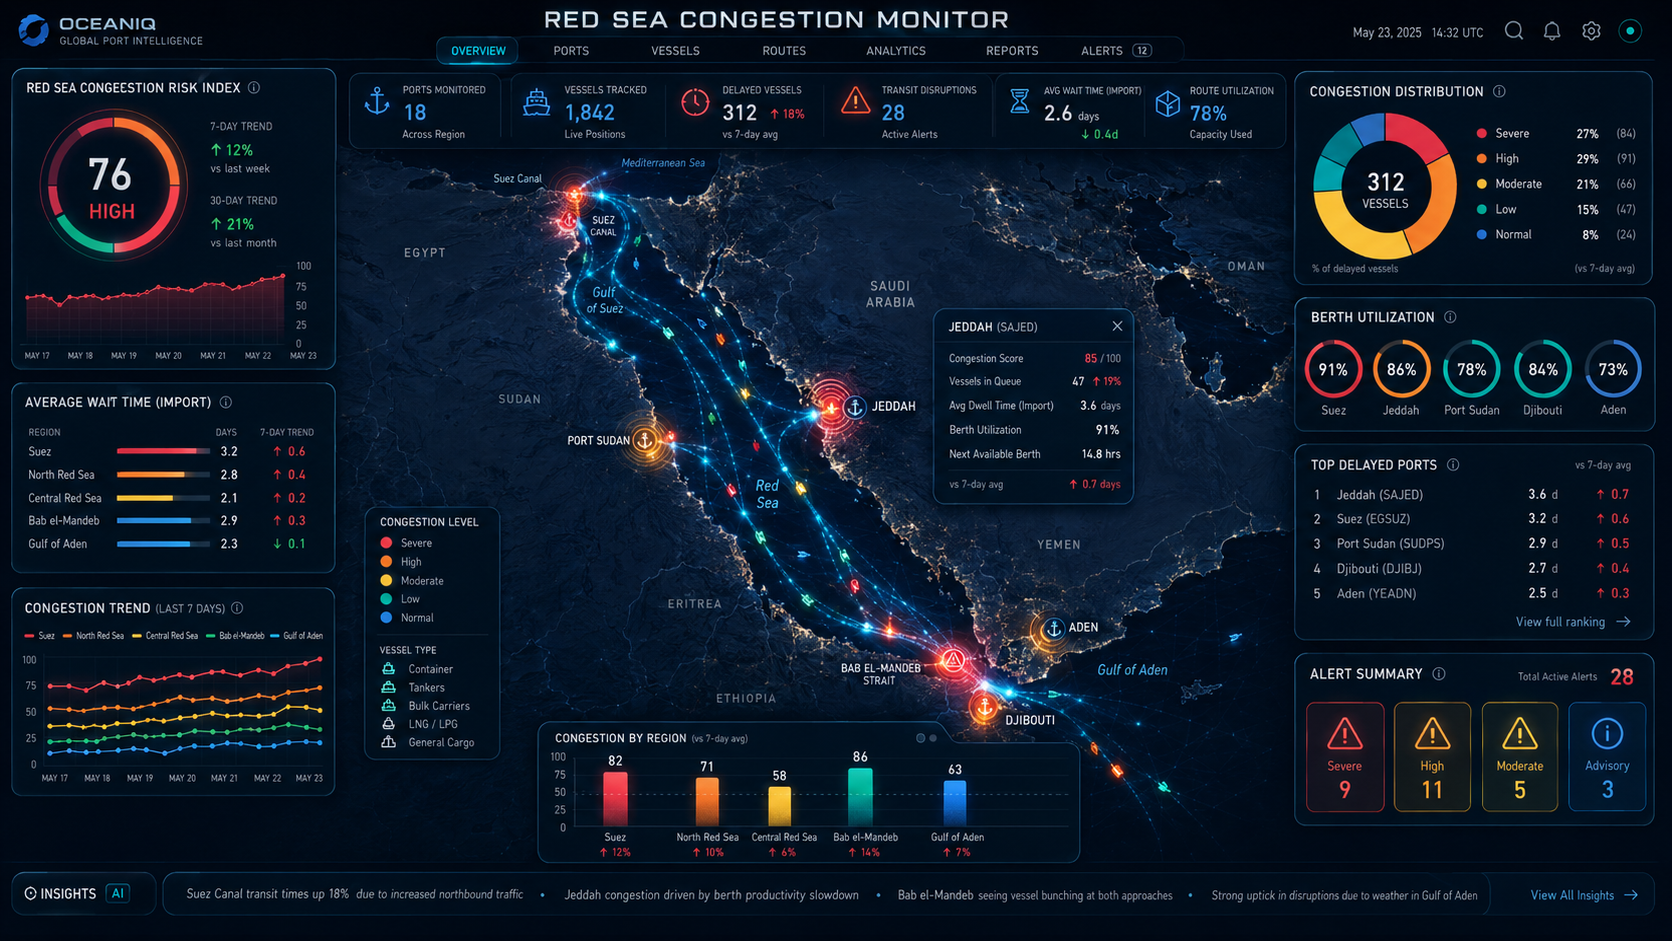
Routes, ports & chokepoints
Network Disruption
Monitor the global network through an Australian supply chain lens. Sentinel connects route conditions, port throughput and emerging disruption events to show where pressure is building before it reaches your operations.
25 global maritime chokepoints
Australian port throughput (TEU)
Global elections & GDACS events
WTI disruption indicators
Sentinel signal
ASPCI
Australian Supply Chain Pressure Index
What your team gains
Identify rising network pressure early, prioritise the routes that need attention and brief stakeholders with a clear Australian impact signal.
02 / 03
02 / 03
Global inputs, local price pressure
Fuel Markets
Bring the variables shaping Australian fuel costs into one view. Global crude benchmarks and regional refined-product prices are translated into locally relevant signals for planning, procurement and cost conversations.
Brent & WTI crude benchmarks
Singapore MOGAS & GASOIL
Australian Terminal Gate Price
USD/AUD exchange rate
Sentinel signal
AFPPI
Australian Fuel Price Pressure Index
What your team gains
See the drivers behind local fuel movements, anticipate cost pressure and make purchasing or surcharge decisions with stronger evidence.
03 / 03
03 / 03
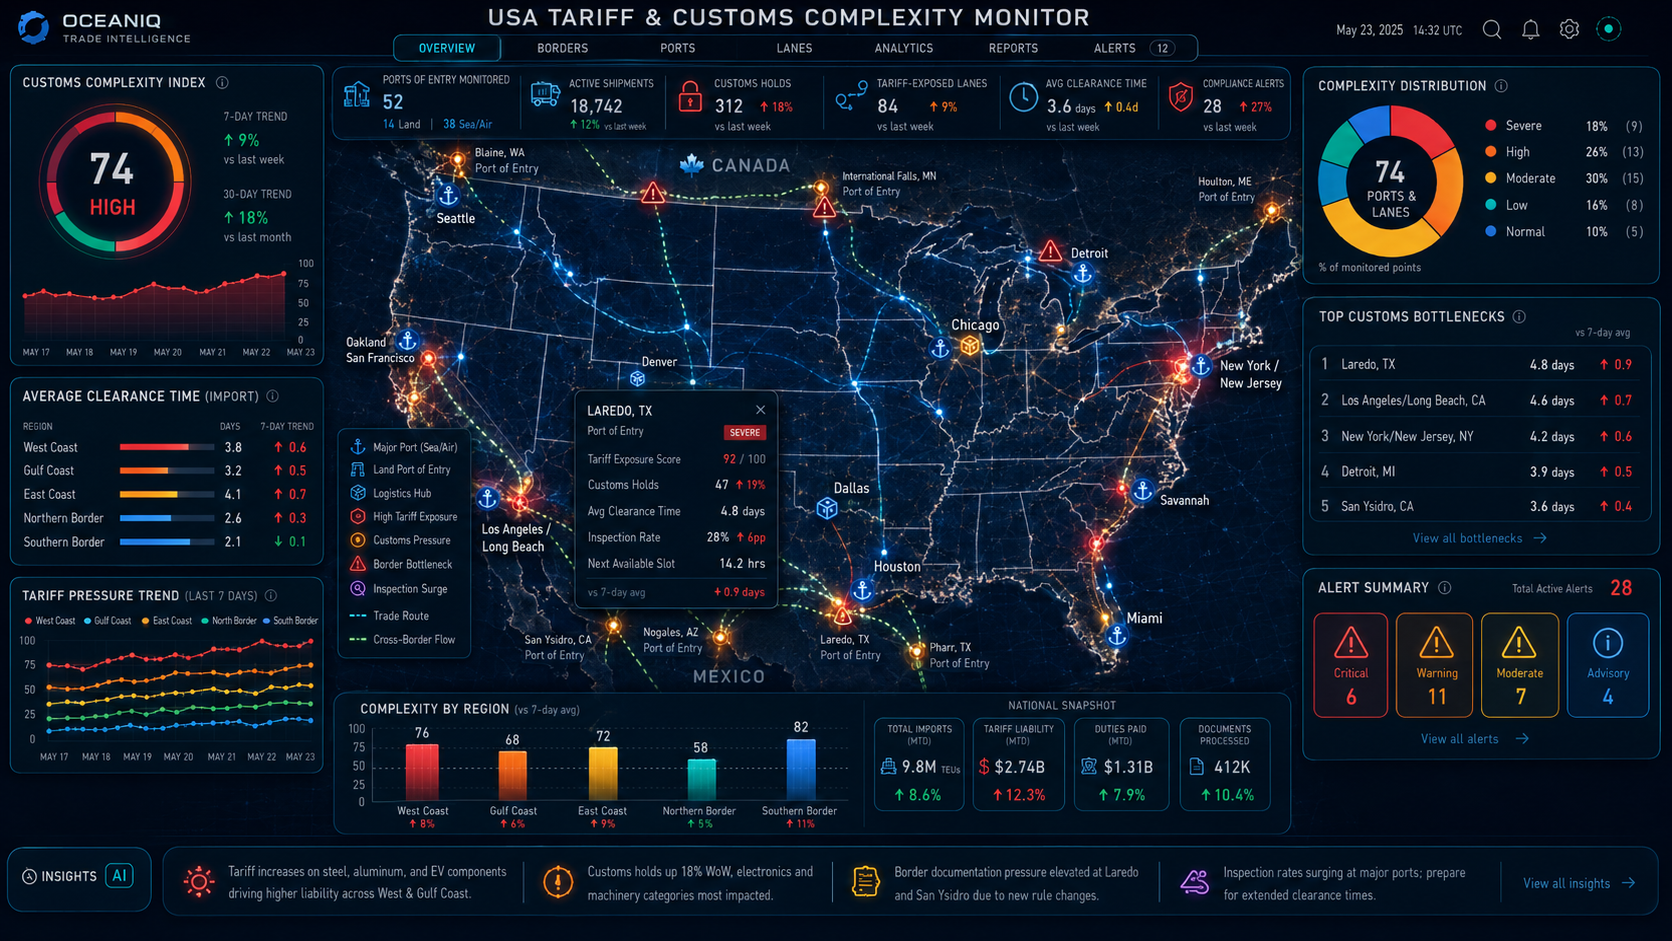
Commodities, lanes & partners
Global Trade
Track Australian imports and exports alongside the performance of key trading partners. Time-series analysis reveals structural shifts while prediction models help teams prepare for changes in demand, trade lanes and network conditions.
Australian import & export flows
Key trading partner performance
Commodity and trade-lane trends
Time-series forecasting models
Sentinel signal
FORECAST
Forward-looking trade intelligence
What your team gains
Spot changes in trade performance over time, understand which markets are moving and plan around emerging opportunities or disruption.
Data plus interpretation
Every dashboard is supported by regular deep-dive articles combining quantitative signals with expert context. Understand what changed, why it matters to Australian trade and supply chains, and where your team should focus next.
From live intelligence to a decision you can defend.
Ten embedded tools help your team optimise everyday choices, simulate high-impact disruption and build a quantified case for stronger supply chain resilience.
01Optimise & compare
Turn operating variables into better commercial decisions.
Model ordering, freight and contract choices with guided tools that make cost, capacity and risk trade-offs easier to defend.
01
Embedded tool
Inventory Optimiser
Calculate economic order quantity for selected SKUs using order cost, lead time, revenue and unit economics. Sentinel also recommends safety stock, runs inventory diagnostics and creates a practical policy your procurement and ordering teams can use.
Decision outputs
EOQ & safety stock
Shareable inventory policy
02
Embedded tool
Incoterms Comparator
Describe the shipment lane, cargo value and your tolerance for cost and risk. A guided assessment recommends the most suitable Incoterm, itemises each party’s obligations and shows exactly where cost ownership and risk transfer change hands.
Decision outputs
Recommended Incoterm
Liability & cost breakdown
03
Embedded tool
Airfreight ULD Comparator
Compare airfreight unit load devices by cargo profile, dimensions and operating requirement. Get a fit calculation, aircraft compatibility matrix and a clear recommendation for the container or pallet best suited to the job.
Decision outputs
Aircraft compatibility
Product fit calculation
02Disruption lab
Stress-test the network before disruption tests you.
Run credible scenarios across ports, chokepoints and your own network to expose downstream impacts, recovery limits and diversion options.
01
Embedded tool
Port Disruption Simulator
Select a port and simulate a disruption to see where cargo, capacity and pressure may spill over. Diversion analysis helps teams compare alternatives, quantify likely consequences and build stronger business continuity plans before an event occurs.
Decision outputs
Spill-over analysis
Diversion scenarios
02
Embedded tool
Chokepoint Disruption Simulator
Model the closure or constraint of a major global chokepoint. Sentinel traces affected lanes, likely diversion paths and secondary congestion so you can identify exposed flows and prepare a response around the routes that matter most.
Decision outputs
Lane impact analysis
Diversion & congestion effects
03
Embedded tool
Network Disruption Simulator
Build a custom disruption around any node, product or lane in your supply chain. Add cost and dependency factors, then model time to recover against time to survive to put credible financial and operational evidence behind risk planning and business continuity decisions.
Decision outputs
Time to recover vs survive
Costed continuity scenarios
03Resilience economics
Find weak points and put a value on resilience.
Move beyond qualitative risk scores with diagnostics that reveal structural exposure, quantify business impact and prioritise investment.
01
Embedded tool
Single Point of Failure (SPOF)
Map what your operation truly depends on and uncover where one failure could cause disproportionate damage. Detect sole sourcing, geographic and gateway concentration, plus hidden sub-tier convergence behind suppliers that appear independent.
Decision outputs
Dependency concentration
Mitigation priorities
02
Embedded tool
Dual-Source vs Single-Source ROI
Test whether a second supplier earns its premium. The model weighs unit cost, qualification and management overhead against avoided disruption loss and restored negotiating leverage—then identifies the disruption probability where dual sourcing becomes the better decision.
Decision outputs
Decision break-even point
Risk-adjusted sourcing ROI
03
Embedded tool
Downtime Cost & Business Impact
Quantify the real cost of an operational outage by hour, day and event. Model how losses escalate as buffers expire, compare scenarios on an annualised basis and test whether a proposed mitigation pays for itself.
Decision outputs
Escalating outage cost
Mitigation payback test
04
Embedded tool
Resilience Maturity Assessment
Answer 24 evidence-led questions across six resilience domains by selecting the description that reflects how you operate today. Receive a maturity level for each domain, an honest view of constraints and a prioritised roadmap for improvement.
Decision outputs
Six-domain maturity profile
Prioritised action roadmap
One platform · ten practical tools
Replace disconnected spreadsheets and subjective assumptions with repeatable analysis your operations, procurement and leadership teams can review together.
Deep dives are frequently published updates on significant industry developments and emerging topics. Each one distils a complex issue into clear written analysis, giving teams the context behind the signal without the burden of sorting through the noise themselves.
Decision intelligence, ready to use
Every deep dive sets out the expected supply chain impacts and recommended actions, helping users move from understanding an issue to making an informed decision.
Sentinel is for anyone, but it is designed for supply chain leaders, operators and specialists. It provides a broad risk and disruption forecasting layer to help mitigate operational risk in your own supply chain or in supply chains you help manage.
08Where does the data come from?
Each report has different data sources, all listed within the application. Data is procured from various government and independent sources, then verified, transformed and interpreted for you.
09How up-to-date are the dashboards?
Dashboards update within 30 seconds of new data becoming available. Some datasets, however, are only published by their sources weekly or monthly.
10What are the deep dives?
Deep-dive analysis articles provide pre-interpreted insights into global and local network risks, topics and updates. They are designed to be consumed in 5–10 minutes and can include infographics, podcasts and short-form videos.
11How do the podcasts and videos work?
You can listen to podcasts and watch videos directly within the application on desktop, tablet or mobile devices.
12What are the “Deep-Dive Briefing” files?
We provide pre-curated, professional PowerPoint and document briefings on selected issues. You can reuse and customise them for presentations to your own organisation, clients or colleagues.